
Overview

In today’s world, gaining visibility across operations is increasingly challenging due to legacy systems, disconnected applications, and data silos. Critical asset information is often scattered across multiple OT systems, historians, IoT platforms, and enterprise applications, making it difficult to identify issues proactively or respond quickly to operational disruptions. Equipment can sometimes operate outside expected conditions without early detection, leading to unexpected failures. Traditional fixed-threshold monitoring ends up creating false alerts, making it harder for operations teams to focus on what truly matters. These challenges can result in unplanned downtime, reduced production efficiency, higher maintenance costs, and missed opportunities for operational optimization.
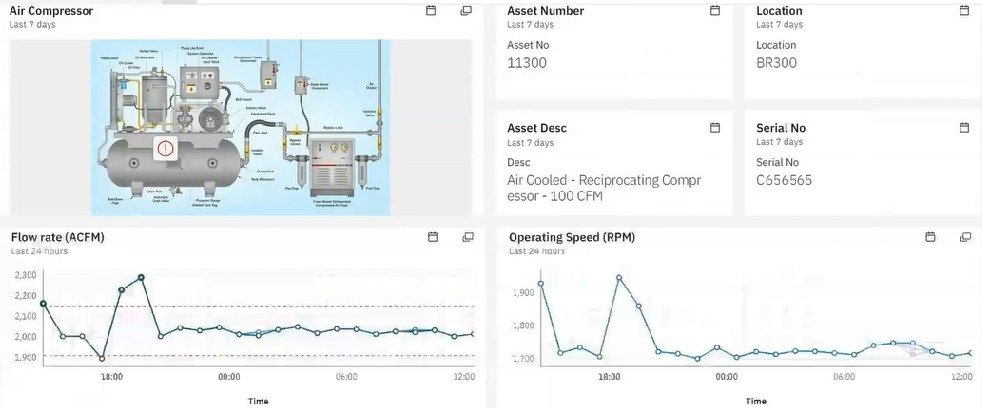
IBM Maximo Monitor addresses these challenges by integrating advanced analytics into asset monitoring and operational control. IBM Maximo Monitor is an application in Maximo Application Suite which helps to perform real time remote monitoring of the asset. The application provides near real-time visibility, root-cause troubleshooting, anomaly detection, and AI-driven alerts by combining live operational data with historical insights, enabling smarter and more efficient asset management. By connecting seamlessly with existing OT systems and consolidating operational data across the enterprise, Maximo Monitor helps with meaningful insights through the dashboard capabilities.
With a single, intuitive dashboard, Maximo Monitor enables organizations to scale monitoring and visualize operations enterprise-wide. It forms the foundation for predictive maintenance and proactive asset health management, helping organizations move from reactive operations to data-driven decision-making, improving uptime, efficiency, and overall operational performance.
Monitor Features
Data Source
| Data Source | Details |
| Device | Device Library : The library contains manufacturer-specific devices that contain default metrics, dimensions, and device details. Setup device and deploy the device and settings to the gateway or edge device. Protocol Settings for Library Devices – Modbus TCP/IP – Modbus RTU – EtherNet/IP – BACnet/IP – S7-Ethernet – Allen-Bradley – OPC UA |
| Custom Device : The device can created with custom/user identified metrics, dimensions, and device details. Custom devices such PLCs or OPC-UA servers, or industrial devices can be added to device library by scanning the following protocols. The data can be configured to split across multiple devices that are connected to the same PLC or OPC UA server. – Allen-Bradley – BACnet/IP – MTConnect – OPC-UA – Ethernet/IP | |
| Add data using REST APIs : Physical devices are not required to connect to the IoT tool. Instead, the REST API can be used to send device data to the IoT tool. | |
| Load Data | Built-In Python Function |
| Custom Python functions | |
| Integrate | Maximo Real Estate and Facilities : Unify location hierarchies and enable more advanced IoT device monitoring and analytics |
| Cisco Webex : Monitor environments and space utilization in buildings | |
| Cisco Spaces : Understand movement and usage across spaces and uncover utilization insights |
Device Type & Device
Device type represents either the physical type of the device or the type of asset or entity for which the device is used. Devices are always grouped by their device type, and a device type must be created before devices can be added.
A device is a physical or virtual asset that sends data for monitoring and analysis. Before a device can connect to IBM Maximo Monitor, it must be registered with an organization. Registered devices in Maximo Monitor are uniquely identified by a device identifier that consists of the following components: Class ID, Organization ID, Type ID, and Device ID. Devices publish data to Maximo Monitor through events.

Gateways
A gateway is an intermediary device or service that collects data from one or more devices and forwards it to IBM Maximo Monitor. Gateways are specialized devices that combine the capabilities of both an application and a device.


Templates
Templates are predefined or custom configurations that encapsulate calculated metrics and dashboards. It can be associated with specific resource types and applied to individual or multiple resources. Users can create templates by defining calculated metrics and dashboards for a particular resource type, then save and reused across similar resources to ensure consistency and reduce configuration effort. Templates support both built-in and user-defined configurations, providing flexibility, scalability, and easier management of monitoring setups.

Omnio Edge
Omnio Edge is a combination of industrial data connectors and edge gateway capabilities that help collect data from assets, PLCs, and OPC servers, and send it to IBM Maximo Monitor in a unified format. It features a user-friendly UI that allows users to integrate devices and collect data in just a few clicks. The platform includes thousands of device connectors that deliver unified data, with new connectors developed as per demand. It also enables easy scraping, browsing, and unification of PLC data.


Analyse
Built In Function


| Function | Metrics | Purpose |
| AggregateTimeInState | Batch data metrics | Transform |
| AggregateWithCalculation | Batch data metrics | Transform |
| AggregateWithExpression | Batch data metrics | Transform |
| AnomalyGeneratorExtremeValue | Batch data metrics | Anomaly simulator |
| AnomalyGeneratorFlatline | Batch data metrics | Anomaly simulator |
| AnomalyGeneratorNoData | Batch data metrics | Anomaly simulator |
| ActivityDuration | Batch data metrics | Collect data |
| AlertExpression | Batch data metrics Streaming data metrics | Alert |
| AlertLowValue | Batch data metrics Streaming data metrics | Alert |
| AlertHighValue | Batch data metrics Streaming data metrics | Alert |
| AlertOutOfRange | Batch data metrics Streaming data metrics | Alert |
| ArithmeticOperator | Streaming data metrics | Operator |
| Coalesce | Batch data metrics | Filter |
| CoalesceDimension | Batch data metrics | Filter |
| ConditionalItems | Batch data metrics | Filter |
| Count | Batch data metrics Streaming data metrics only for numeric inputs | Summarize |
| COPODAnomalyScoreJava | Streaming data metrics | All |
| DatabaseLookup | Batch data metrics | Collect data |
| DataQualityChecks | Batch data metrics | Anomaly detector |
| DateDifference | Batch data metrics | Transform |
| DeleteInputData | Batch data metrics | Administer |
| DistinctCount | Batch data metrics | Summarize |
| DropNull | Batch data metrics | Cleanse |
| EntityDataGenerator | Batch data metrics | Simulate |
| EntityFilter | Batch data metrics | Filter |
| FastMCDAnomalyScoreJava | Streaming data metrics | Anomaly detector |
| FFTbasedGeneralizedAnomalyScore | Batch data metrics | Anomaly detector |
| Filter | Batch data metrics | Filter |
| First | Batch data metrics Streaming data metrics only for numeric inputs | Summarize |
| GBMRegressor | Batch data metrics | Anomaly detector |
| GeneralizedAnomalyScore | Batch data metrics | Anomaly detector |
| GetEntityData | Batch data metrics | Summarize |
| IdentifyShiftFromTimestamp | Batch data metrics | Summarize |
| IfThenElse | Batch data metrics | Filter |
| InvokeWatsonStudio | Batch data metrics | Anomaly detector |
| IsolationForestAnomalyScoreJava | Streaming data metrics | Anomaly detector |
| KMeansAnomalyScore | See Description column | Anomaly score |
| KNNKDEAnomalyScoreJava | Streaming data metrics | Anomaly score |
| Last | Batch data metrics Streaming data metrics | Summarize |
| LoadTableAndConcat | Batch data metrics | Transform |
| MatrixProfileAnomalyScore | See Description column | Summarize |
| Maximum | Batch data metrics Streaming data metrics only for numeric inputs | Anomaly score |
| Mean | Batch data metrics Streaming data metrics only for numeric inputs | Summarize |
| Median | Batch data metrics | Summarize |
| MergeByFirstValid | Batch data metrics | Transform |
| Minimum | Batch data metrics Streaming data metrics | Summarize |
| NewColFromCalculation | Batch data metrics | Transform |
| NewColFromScalarSql | Batch data metrics | Transform |
| NewColFromSql | Batch data metrics | Transform |
| NoDataAnomalyScore | Batch data metrics | Anomaly detector |
| OccupancyCount | Batch data metrics | Aggregate |
| OccupancyDuration | Batch data metrics | Aggregate |
| OccupancyCountByBusinessUnit | Batch data metrics | Transform |
| OccupancyFrequencyRate | Batch data metrics | Transform |
| OccupancyRate | Batch data metrics | Transform |
| PackageInfo | Batch data metrics | Administer |
| PrepareTimeInState | Batch data metrics | Transform |
| Product | Batch data metrics | Summarize |
| PythonExpression | Batch data metrics | Transform |
| PythonFunction | Batch data metrics | Transform |
| RaiseError | Batch data metrics | Troubleshoot |
| RandomChoiceString | Batch data metrics | Simulate |
| RandomDiscreteNumeric | Batch data metrics | Simulate |
| RandomNoise | Batch data metrics | Simulate |
| RandomNormal | Batch data metrics | Simulate |
| RandomNull | Batch data metrics | Simulate |
| RandomUniform | Batch data metrics | Simulate |
| Reidentify | Streaming data metrics | Transform |
| RobustThreshold | Streaming data metrics | Anomaly detector |
| SaliencybasedGeneralizedAnomalyScore | Batch data metrics | Anomaly detector |
| SCDLookup | Batch data metrics | Collect data |
| ShiftCalendar | Batch data metrics | Collect data |
| Sleep | Batch data metrics | Troubleshoot |
| StandardDeviation | Batch data metrics Streaming data metrics | Summarize |
| SpectralAnomalyScore | Batch data metrics | Anomaly score |
| SpectralAnomalyScoreExt | Batch data metrics | Flat lines |
| SplitDataByActiveShifts | Batch data metrics | Transform |
| Sum | Batch data metrics Streaming data metrics only for numeric inputs | Summarize |
| TimestampCol | Batch data metrics | Summarize |
| TraceConstants | Batch data metrics | Summarize |
| Variance | Batch data metrics Streaming data metrics only for numeric inputs | Summarize |
Build Expression
Simple Functions
Expression : If the calculation requires only a single line of code, Monitor has the capability to write the expression directly into the input field of a function. When an expression is written in Maximo Monitor, it is not considered a new Python function; rather, it is treated as an input parameter to an existing Python function. Therefore, the syntax of the expression must align with the requirements of the existing function.
Example :
| Use Case | Expression Block |
| To calculate the distance | df[‘speed’]*df[‘travel_time’] |

Simple Functions
Simple Functions : If the calculation requires multiple lines of code or involves control logic, Maximo Monitor provides the capability to write a simple function. The PythonFunction from the function catalog can be used to add this simple function. It produces a single data item as its output.
Example :
| Use Case | Code Block |
To calculate adjusted distance using distance parameter | def f(df, parameters = None): adjusted_distance = df[‘distance’] * 0.9 return adjusted_distance |

Custom Functions
If the calculation requires multiple lines of code and is too large to be implemented in Maximo Monitor as a simple function, Maximo Monitor provides the capability to create a custom function. Custom functions must be developed as part of a Python package, stored in an external repository such as GitHub Enterprise, and registered with Maximo Monitor. The external repository must expose a URL that is accessible through a pip installation. A custom function can produce one or more outputs.

Monitor
Dashboard
| Dashboard | Details |
| Device Dashboard | Helps to display insights through data for specific devices |
| Summary Dashboard | Helps to display insights through aggregated data by default from all devices of a specific device type |
| Hierarchy dashboards | Helps to display insights on parent resource dashboards from aggregated data from child resources |


Dashboard Cards

| Card Image | Card | Details |
 | Line graph cards – Time series line | Plot time series data. |
 | Simple Bar Chart | Show comparisons of data through simple bar chart |
 | Stacked Bar Chart | Show comparisons of data through stacked bar chart |
 | Value/KPI | Display metrics, dimensions, or alert information. |
 | Data table – Table Card | Display time series data in table format. |
 | Image Card | Each dashboard is made up of a number of features that you can customize. |
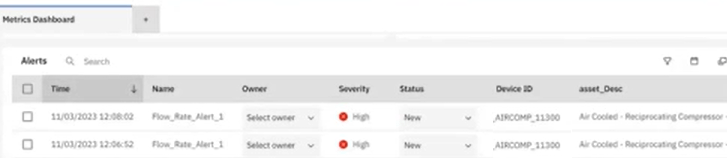 | Alert Table – Alert Card | Shows alerts for the scope of the dashboard on which it displays. |
 | Third-party content card | Shows third-party content, such as images, tables, charts, videos, or lists, to dashboards. |
Monitor To Manage
IoT sensor data or Metrics data (data collected in Maximo Monitor) can be integrated to asset and location meters in Maximo Manage. Metrics are time-based sensor readings from IoT devices. When a device is connected to an asset or location, its metrics can be added to the meter records maintained in Maximo Manage.

Monitor Hierarchy
Maximo Monitor Hierarchy enable organizations to organize assets and devices into logical or physical parent-child structures, such as organization, site, system, location, asset, and device levels. Users can drill down from enterprise-wide views to individual equipment for monitoring and analysis. Metrics and KPIs can be aggregated and rolled up across different hierarchy levels.
Monitor with Manage : Hierarchy maintained in Maximo Manage can be integrated and shared with Maximo Monitor.
Monitor with out Manage : Hierarchy can be uploaded using the CSV file


Alerts & Actions
A service request can be created in Manage from an alert. Alerts help identify data that falls outside defined threshold values. These alerts can be configured using the built-in functions listed below.
| Function | Details |
| AlertExpression | Function trigger an alert when the value of a data item attains a specified level, goes below particular level, or deviates from the specified range. |
| AlertLowValue | Function trigger an alert when the data item value goes below lower threshold value. |
| AlertHighValue | Function trigger an alert when the data item rises above upper threshold value. |
| AlertOutOfRange | Function trigger an alert when the data item value rises above upper threshold or goes below lower threshold value. |


Benefits
- Enables remote monitoring and improves operational control
- Integrate data from Historians, IoT sensors & Connect seamlessly with existing OT systems to collect operational data.
- Create dashboards to visualize current and historical trend data for better insights and analysis.
- Asset hierarchies can be shared with IBM Maximo Manage
- Establish hierarchies and navigate through layers of data from a system-wide view to individual devices.
- Ability to apply AI-powered anomaly detection
- Apply analytical functions to the input data and visualize the results using value cards, tables, images, line charts, and alert tables.
- Apply anomaly detection to the input data to identify outliers, missing gaps, and flat-line patterns, with anomalous data points highlighted on line graphs.
- Create alerts for varying data conditions, and manage them through the alert table in Maximo Monitor to initiate a service request in IBM® Maximo Manage.
- Delivers insights beyond the traditional fixed-parameter alerts
- Sets the foundation for predictive maintenance and asset health
- Improves asset and operational availability
- Scalable across processes and sites
- Reduce unplanned downtime and Increase production output
Leave a Reply